
The browser console is a powerful tool for developers working on a website. I was surprised how feature-rich the humble DevTools console tab is!
This article explains how to use the Console tab in Chrome's developer tools, starting from the basics before looking at many of its more advanced features.
What is the browser console?
The console is a developer tool that surfaces errors, warnings, and other log output about the page that's currently open in the browser. It allows developers to view these messages without them impacting normal visitors.
In addition to that, the browser console also lets you run JavaScript code on the page. This console functionality is also referred to as a REPL (read-eval-print loop). The browser reads the code snippet provided by the developer, evaluates it, and then prints the result as a console message.
How to open the browser console in Chrome DevTools
To open the Chrome console you first have to open Chrome's developer tools and then switch to the Console tab.
- Right-click the web page
- Click on Inspect
- Switch from Elements to Console
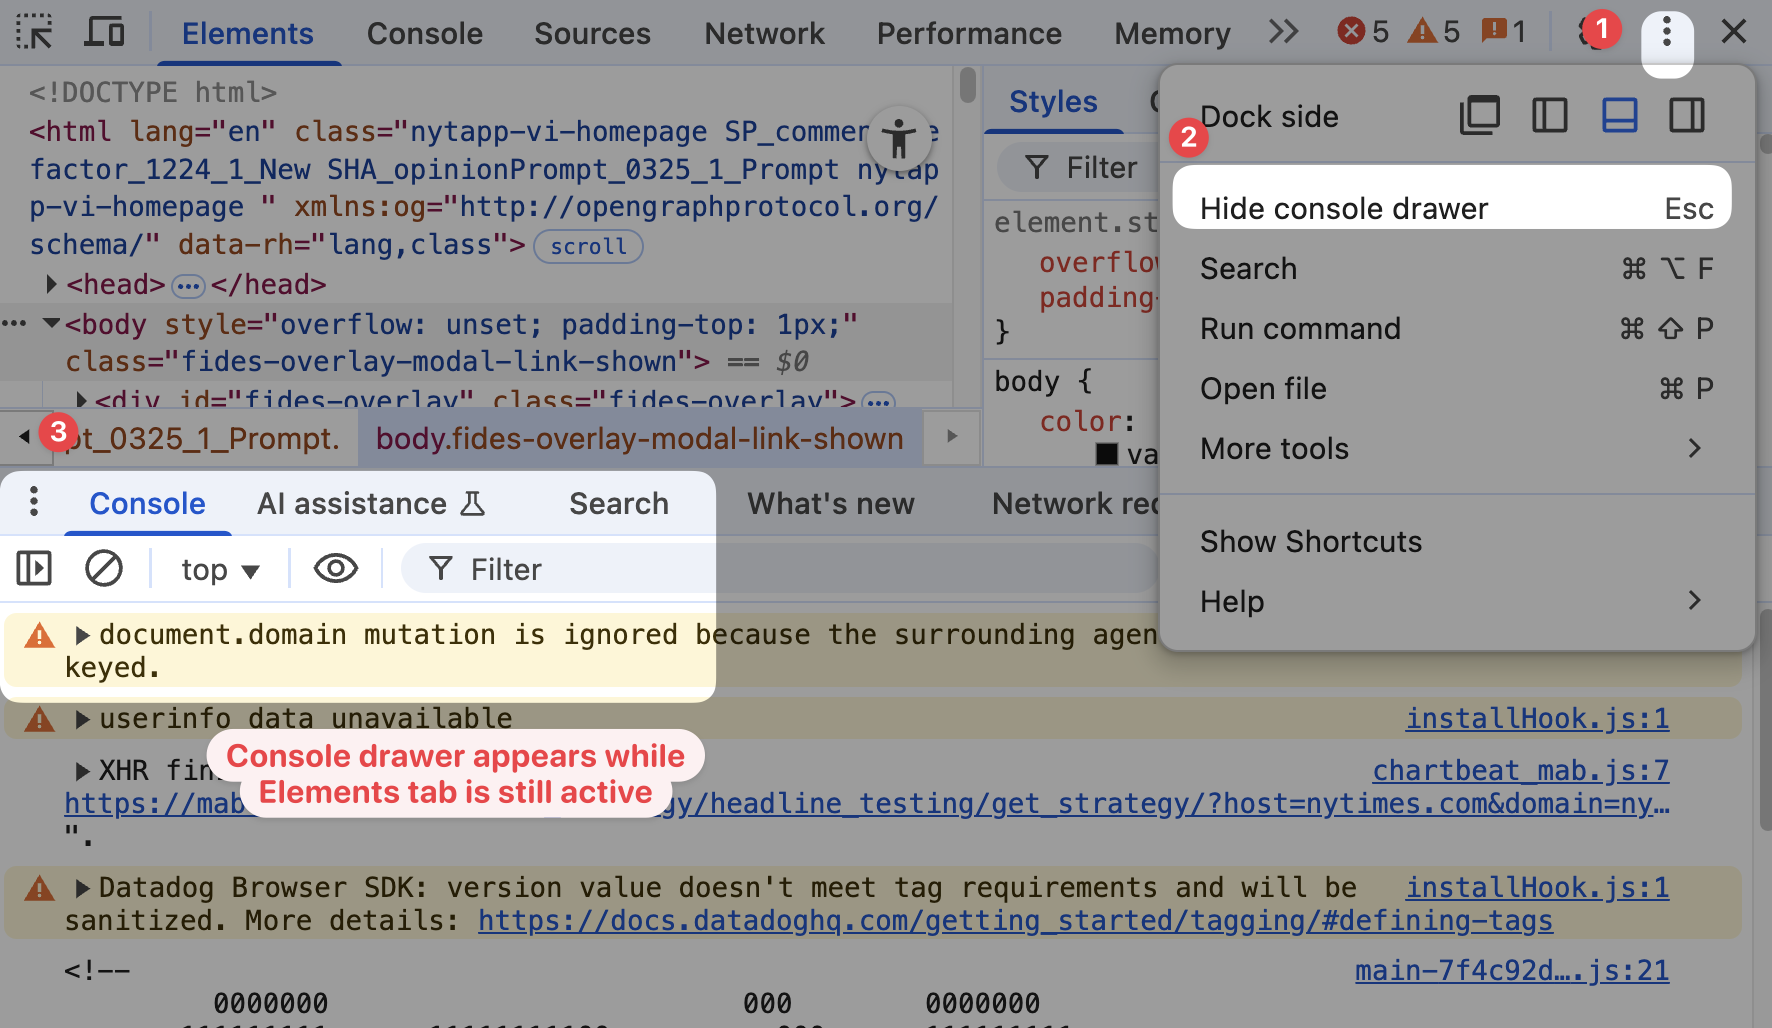
You can also open the console as a drawer on top of an existing DevTools tab. Click on the three dots in the top right and select Show console drawer from the menu. Or just press the Escape key!
How to check errors and warnings in the console
The browser console shows messages from many different sources:
- JavaScript
consolecalls - Failed network requests
- Issues identified by the browser, like poor performance or the use of outdated APIs
JavaScript console logs can be left for all sorts of reasons. In this example on the New York Times homepage we see a recruitment message pointing developers to the careers page. DataDog, a third-party analytics tool, is reporting a configuration issue. There's also a note that no user data was found when loading the page.

You can click on the arrow next to each console log to find out what it was shown. The browser shows a call stack listing all the function calls leading up to generating the log message. You can click on each of these source code locations to view the relevant code.

AI Console Insights
If you're not sure what an error means, Google has recently added an AI Console Insights feature to Chrome. Before you can use it you first have to enable it in the settings.
When asking for an explanation of a message, Chrome sends the message text, stack trace, and related code to Google servers where the AI analysis takes place.

Once AI insights are set up you can hover over each error or warning and you'll get an "Understand this error" or "Understand this warning" message.
After clicking the button Google generates an explanation of the message within a second or so.

Search and filter
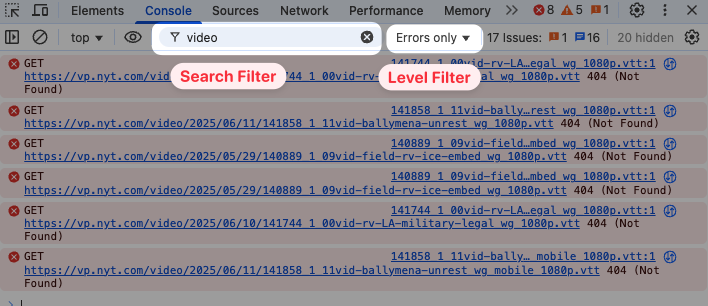
If you see many messages on a page it can be helpful to use the filtering functionality at the top of the console tab.
You search for console logs matching a specific string or only view logs of a specific alert level, for example "error".
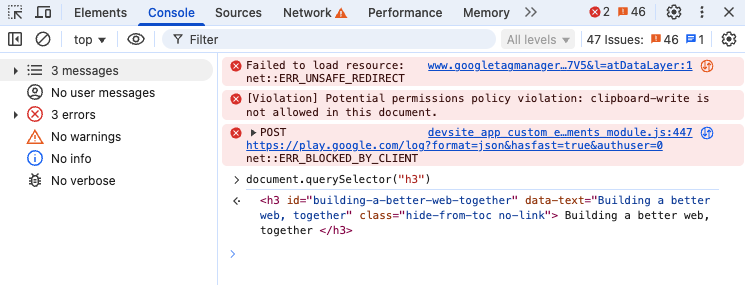
For additional options you can open the console sidebar. Here you can see how many messages of each type have been logged and what files they were logged from.
You can also click on each item in the sidebar to only view matching messages.

It's easy to forget that you've filled in the search field in the console tab. Check your filter settings if you expect to see a console message but it's not showing up.
Clear console messages
Got too many messages, making it hard to see new output that gets logged? Just click the Clear Console button in the top right of the console tab.

Run code in the JavaScript console
In addition to letting you website log output, the browser console also lets you run JavaScript on the current web page.
Simply type in a valid expression like 4 + 8 and Chrome will evaluate it and log the result.
You can also access elements from the page DOM, for example to edit styles or text content programmatically.
document.querySelector("h3").style.color = "red";

Inspect elements that disappear when entering DevTools
One of my favorite debugging snippets is this little script:
setTimeout(() => {
  debugger;
}, 5000);
It waits 5 seconds and then pauses code execution in the JavaScript debugger. That means nothing can change on the page and it will be frozen in place.
If your page has a dropdown or a text box that only expands when it has focus, then you can run the snippet, open the dropdown or text box, and wait a few seconds. Then you can switch to the DevTools Elements tab to inspect the page in that frozen state.

View recently run JavaScript commands
Use the Arrow Up key on your keyboard to restore recent commands and run them again! The browser console stores a history of the code you've evaluated in the console, and it even persists between tabs and websites!
Select a JavaScript context
If your website uses iframes or service workers you need to check that the code you run in the console is running in the right context. The DOM and global values you can access will depend on what frame your code is running in.
Chrome provides a JavaScript context selector in the top left of the console tab. The default is the top frame on the page.

Depending on what context you select the location.href value will be different.

Chrome extensions also have their own JavaScript context.
How to log errors, warnings & much more
Use the console object to output messages from your own JavaScript code. Here's an example:
console.error("Big problem");
console.warn("Minor worry");
console.log("Some message");
console.info("Extra info");
console.debug("Debug info");
In Chrome, the output looks like this:

By default, the console.debug message does not show up in the Chrome browser console, because the log level is excluded in the default settings.
You need to enable showing verbose messages to see it.

While Chrome treats console.log and console.info messages, Safari shows different icons for each message type.

Logging more than just text
Console output isn't just for messages! You also log data objects, arrays, functions, or DOM elements. And you can pass multiple arguments to each log call.
console.info(["a", "b"], Math, document.querySelector("h2"));

Click on each object in the log message to expand it and view all of its properties.

Browsers store a reference to logged objects instead of a serialized version. If the object has changed since it was logged you'll see the most up-to-date version when expanding it.
Right-click logged DOM elements to view easily view them in the Elements panel of Chrome DevTools.

Store as global variable: access logged objects
What if you see an object logged in the console and you want to call a function on it or process its data?
Right-click the object and look for the Store as global variable option. This will create a variable called temp1 that you can use in the console going forward.

Color and format console messages
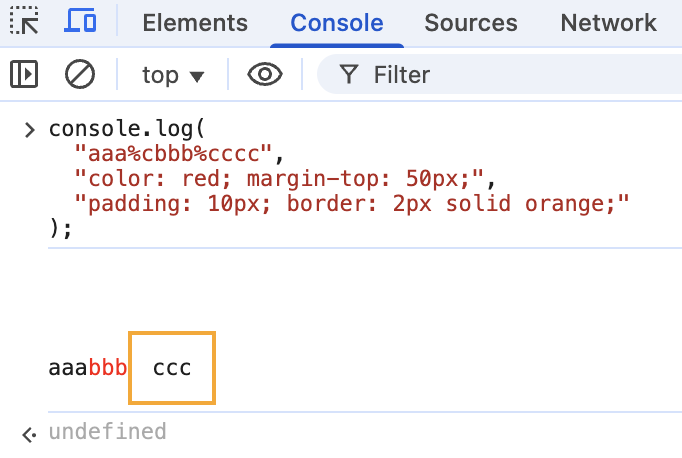
You can apply some CSS styles to your console messages! Add the %c format specifier in front of the text you want to format and then pass the CSS styles as additional arguments to the console.log call.
console.log(
  "aaa%cbbb%cccc",
  "color: red; margin-top: 50px;",
  "padding: 10px; border: 2px solid orange;"
);
You can even display Base64 images in the console!
const logo = `data:image/png;base64,iVBORw0KGgoAAAA...`;
console.log(
  "%cChrome",
  `padding:80px;
  background: url(${logo});
  background-size: contain;
  background-repeat: no-repeat;
  font-size: 30px;`
);
With a few extra styles we can use the image as the background for our console message.

console.trace
We've seen that Chrome automatically captures a stack trace for console errors and warnings. But what if you want to track where a function is called just for debugging?
That's where console.trace is helpful! In addition to the log message it also provides a call stack showing function names and code locations leading up to the console log.
const funcA = () => {
  funcB();
};
const funcB = () => {
  console.trace("In funcB!");
};
funcA();
When evaluating code without a source URL Chrome shows the file name as VM.

console.table
What if you're logging a big long array? Making sense of the data you're seeing isn't very easy.

Passing the array to console.table allows you to format the data in a nice way.
console.table(countryPopulation);
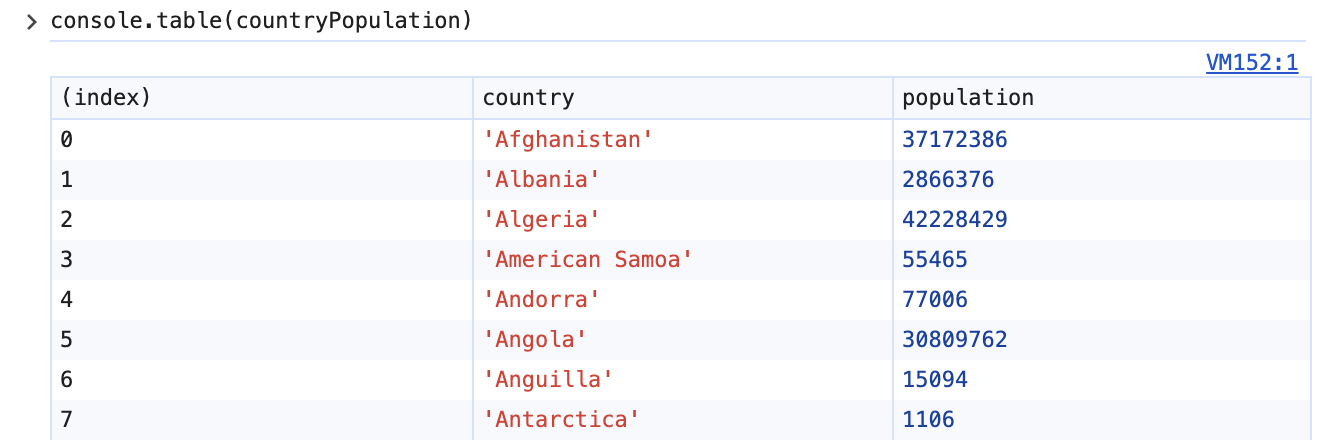
On top of that, you can even click on the table headers to sort the data!

console.count
Wondering how often something happens on the page? console.count provides an easy way to track event counts without writing custom tracking code.
console.count("Render PageContentContainer");
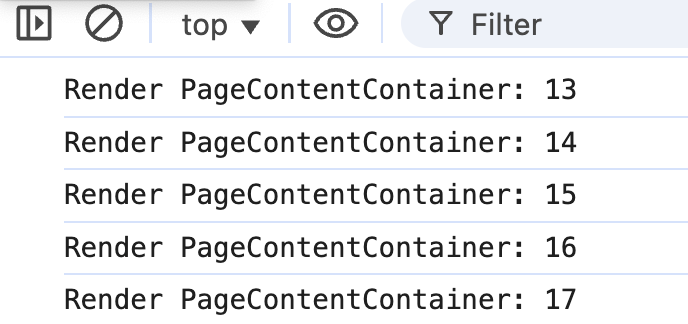
You can also call console.countReset to reset the counter back to zero.
console.time, console.timeLog, and console.timeEnd
If you want to measure how long different parts of your code take to run, Chrome provides a set of three timing functions:
console.timestarts a named timerconsole.timeLoglogs the current elapsed timeconsole.timeEndends the timer and logs the duration
You need to pass in the name of the timer for each function call.
console.time("Page initialization");
console.timeLog("Page initialization", "Start first app render");
console.timeEnd("Page initialization");

console.group
What if you've got a lot of info to track, but you're not sure what you'll actually need for debugging?
console.group allows you to define collapsible groups of messages in the console output. You can also use console.groupCollapsed to hide the messages in the group to start with.
console.log("Some info");
console.groupCollapsed("Lots of info");
for (let i = 0; i < 100; i++) {
  console.log(Math.random());
}
console.groupEnd("Lots of info");
console.log("More info");

Better productivity with the Console Utilities API
You can use all the normal browser API in the console. But on top of that you also get some special features as part of the Console Utilities API.
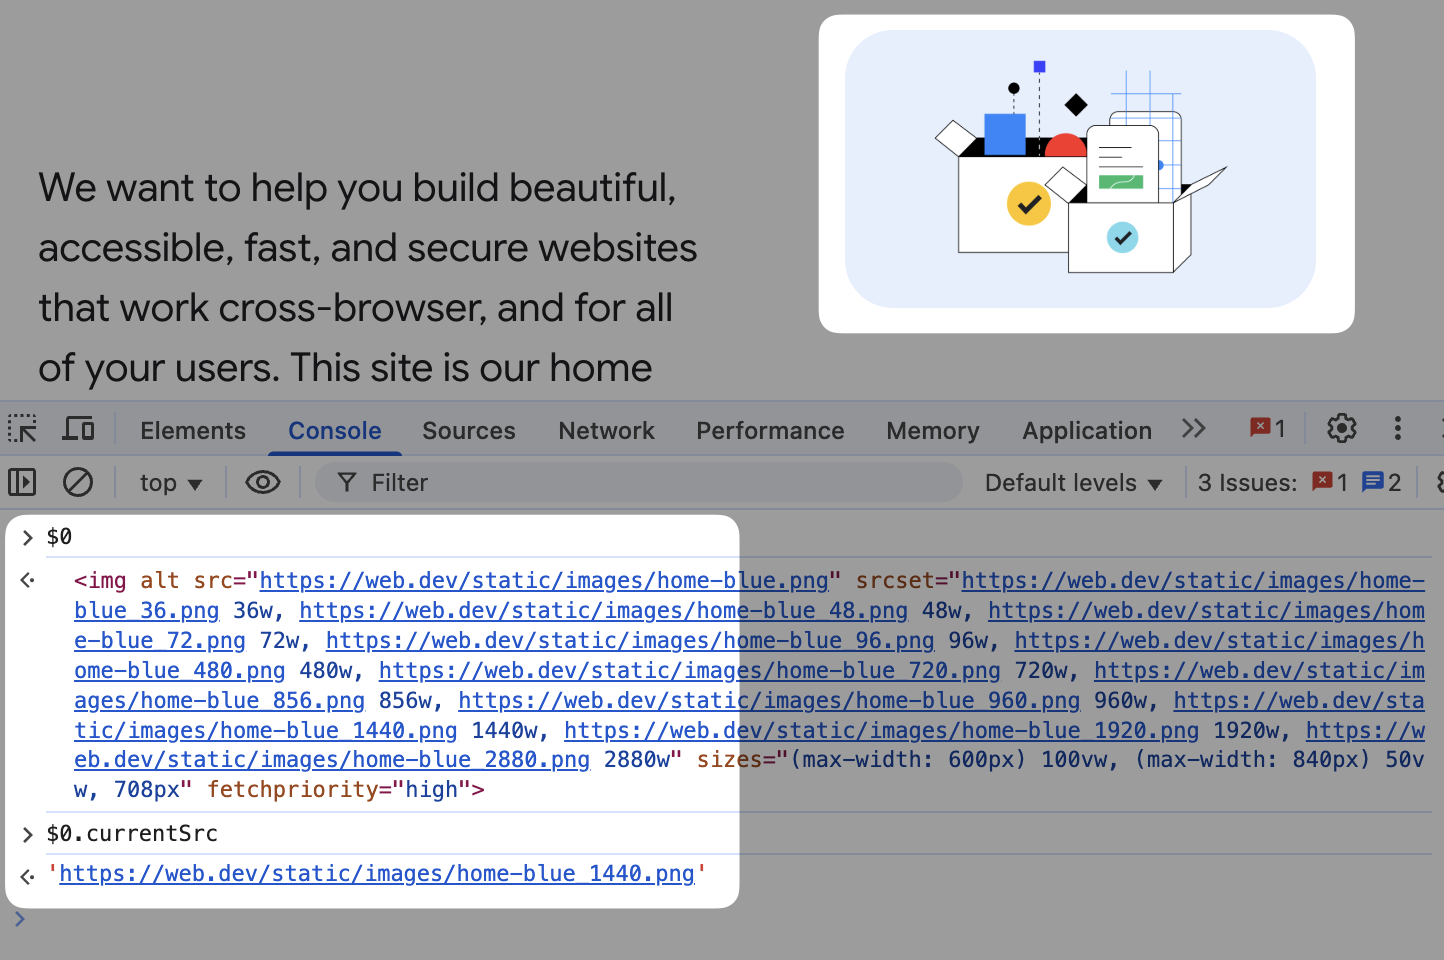
$0: Reference the current DOM element
Earlier we used document.querySelector to get a reference to a page element. Finding the right element selector isn't always easy, but luckily browsers offer an alternative!
If you select a DOM element in the elements tab then you can access a reference to it in the console using $0. You can then use it like any other variable, to gather additional information or modify the element.
You can also access elements that were previously selected using $1, $2, $3, and $4.
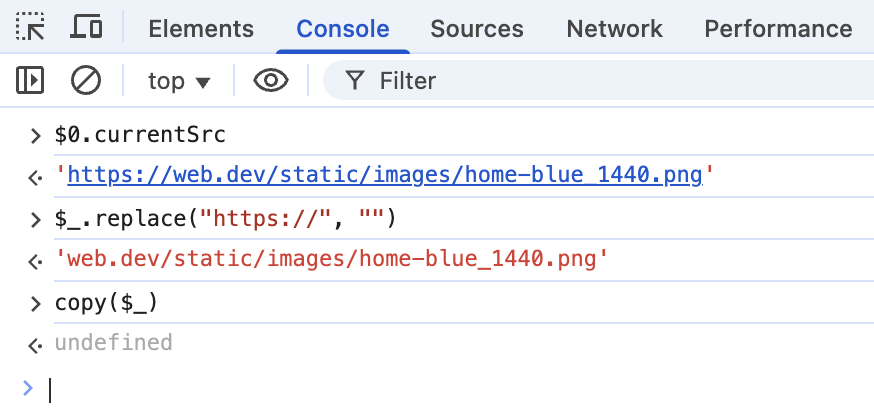
copy: store content in the clipboard
You can pass any expression to the copy function and it will be converted to a string and stored in your computer's clipboard. Then just paste it wherever you need it.

$_: Get the most recent evaluation result
What if you ran some code and now want to paste the result elsewhere? Simple, run copy($_)!
$_ refers to the value of the last JavaScript expression you evaluated in the console. If you need to run a series of steps on an object, $_ makes it easy to access the last result without having to re-run the whole expression.
monitor: log function calls
Wondering how often a function is called and with what arguments? The monitor function generates a console log with details on each function call.
monitor(window.scrollTo);
window.scrollTo(0, 2000);
You can use monitor on built-in functions like scrollTo above, or for custom code.

Call unmonitor to stop the function call logs.
debug: pause execution when a function is called
You can use debug if you want more detail and control when investigating a function call. When the function you pass in runs, the browser will pause code execution.
debug(window.scrollTo);
Call undebug to remove the breakpoint you've set.
monitorEvents: log events on DOM elements
The monitorEvent produces a log message for every event triggered on a DOM node.
monitorEvents(document.body);
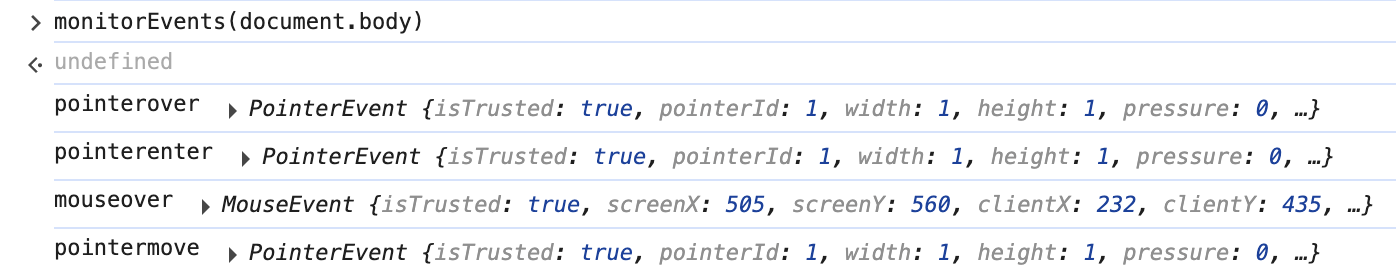
As you can see, reporting all event types can get quite busy! To avoid that you can also pass in an array of event types that you care about.
monitorEvents(document.body, ["pointerenter", "click"]);
Disable the logs with unmonitorEvents.
getEventListeners: identify attached event listeners
Use getEventListeners to get references to all event handlers attached to an element.
getEventListeners(document.body);
You can see the type of event listener as well as other properties like whether it's set up to only fire once. You also get a reference to the function that's set up as the handler.
Right-click on the function and select Show function definition to jump to the function source code.

queryObjects: find objects by constructor
The queryObjects function returns a list of objects created with the constructor you pass in. That can be a built-in type like Function or Promise, or a class you define in your own code.
queryObjects(Function);

profile and profileEnd: collect a performance recording
The Chrome DevTools performance profiler is a powerful tool to collect a detailed recording of what's impacting your page speed.
You can start a profile in the DevTools Performance panel and then stop the recording when you're done. However, you can run into several issues:
- You don't tightly control when data is collected, so you'll have to zoom in to the right place later on
- Recording several repeated profiles is a slow manual process
- Larger traces can take a long time to load in the developer tools
The profile and profileEnd functions solve all of these problems. You can start and end a performance profile programmatically at just the right time.
console.profile();
// Do a bunch of stuff that's slow
console.profileEnd();

You can call console.profile directly in your application code and it will work when you have the console open. However, if you just call profile you may get a profile is not defined error.
Live expressions
Live expressions are great if you find yourself regularly running the same JavaScript expression to check the state of the page. Instead of manually running code, live expressions let you configure Chrome to keep doing that automatically.

Console settings
You can configure console settings by clicking the gear icon in the top right of the Console tab.
For, example you can check Preserve log to keep log output around when navigating across different websites and pages. By default the console is cleared for every new navigation.

You can also enable or disable specific types of messages generated by Chrome:
- Hide network hides failed requests
- Log XMLHttpRequests logs every Ajax or Fetch request on the page
- Show CORS errors in console logs why cross-origin requests have failed

Conclusion
There are a lot of features in the Console tab, and we've not covered them all in this article. You can check out Google's console features reference to learn more.